配置业务跟踪
应用环境
业务跟踪是一种业务调试、诊断、检错的手段,主要用于维护人员定位用户在接入过程中出现的问题。业务跟踪能够将特定用户在接入过程中的状态变化、协议处理结果等信息输出到终端或服务器,供维护人员进行参考、分析。
配置思路
采用以下思路进行配置:
打开终端调试开关
启用业务跟踪功能
创建业务跟踪对象。
跟踪对象是具有某些相同属性的用户集合的抽象,比如同一接口板下所有用户可以定义为一个跟踪对象。
跟踪对象可以根据以下属性定义:
物理接口号
Trunk号
VLAN
PVC
QinQ VLAN
接入方式
用户名
IP地址
MAC地址
一个跟踪对象至少具备上述属性中的一项。您也可以根据多个属性的组合来进行对对象的跟踪。
配置注意事项
注意
使用业务跟踪功能将使ME60的性能有一定程度的下降,因此建议只在需要进行问题定位时启用,正常情况下不开启该功能。
缺省情况下,业务跟踪功能关闭。
配置实例
组网需求
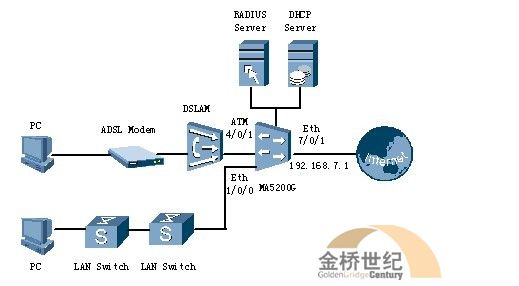
如下图所示,用户使用RADIUS服务器进行认证和计费,从DHCP服务器上获得IP地址,用户经过认证计费后就可以访问网络了。要求分别按照物理接口号、Trunk号、用户VLAN、PVC、QinQ VLAN、接入方式、用户名、IP地址及MAC地址进行业务跟踪。
业务跟踪配置组网图
适用产品和版本
ME60版本为(VRP5.30-13_01)及后续版本。
配置步骤
此处只给出对业务跟踪的配置,用户接入的BAS配置和交换机的配置,在此不再赘述。
按照物理接口号进行业务跟踪。首先在物理端口Ethernet 1/0/0下配置PPP的用户接入。
# 打开终端调试开关。
<ME60> terminal debugging
Info:Current terminal debugging is on
<ME60> terminal monitor
Info:Current terminal monitor is on
# 启用业务跟踪功能。
<ME60> system-view
Enter system view, return user view with Ctrl+Z.
[ME60] trace enable
[ME60]
#Jan 19 14:39:22 2007 ME60 BTRC/6/SWITCHINFO:OID 1.3.6.1.4.1.2011.2.6.2.200.4.1100 The switch of service tracing is ON.
# 创建跟踪对象,按照物理接口号进行业务跟踪。
[ME60] trace object interface Ethernet 1/0/0
#Jan 19 14:40:57 2007 ME60 BTRC/6/ADDOBJ:OID 1.3.6.1.4.1.2011.2.6.2.200.4.1101 Added one trace object (ObjectIndex=1,ipAddr=255.255.255.255).
# 当有用户从Ethernet 1/0/0接口上下线的时候将可以跟踪到该用户。
按照Trunk号进行业务跟踪。首先创建Eth-Trunk 10并将Ethernet 1/0/0捆绑到该接口下,在Eth-Trunk 10接口下配置PPP的用户接入。
# 打开终端调试开关。
<ME60> terminal debugging
Info:Current terminal debugging is on
<ME60> terminal monitor
Info:Current terminal monitor is on
# 启用业务跟踪功能。
<ME60> system-view
Enter system view, return user view with Ctrl+Z.
[ME60] trace enable
[ME60]
#Jan 19 14:39:22 2007 ME60 BTRC/6/SWITCHINFO:OID 1.3.6.1.4.1.2011.2.6.2.200.4.1100 The switch of service tracing is ON.
# 创建跟踪对象,按照Trunk号进行业务跟踪。
[ME60] trace object interface Eth-Trunk 10
#Jan 19 14:41:57 2007 ME60 BTRC/6/ADDOBJ:OID 1.3.6.1.4.1.2011.2.6.2.200.4.1101 Added one trace object (ObjectIndex=2,ipAddr=255.255.255.255).
按照user-vlan进行业务跟踪,用户带VLAN 100上线。
# 打开终端调试开关。
<ME60> terminal debugging
Info:Current terminal debugging is on
<ME60> terminal monitor
Info:Current terminal monitor is on
# 启用业务跟踪功能。
<ME60> system-view
Enter system view, return user view with Ctrl+Z.
[ME60] trace enable
[ME60]
#Jan 19 14:39:22 2007 ME60 BTRC/6/SWITCHINFO:OID 1.3.6.1.4.1.2011.2.6.2.200.4.1100 The switch of service tracing is ON.
# 创建跟踪对象,按照user-vlan进行业务跟踪。
[ME60] trace object user-vlan 100
#Jan 19 14:42:57 2007 ME60 BTRC/6/ADDOBJ:OID 1.3.6.1.4.1.2011.2.6.2.200.4.1101 Added one trace object (ObjectIndex=3,ipAddr=255.255.255.255).
按照PVC进行业务员跟踪,用户通过PVC 10/100上线
# 打开终端调试开关。
<ME60> terminal debugging
Info:Current terminal debugging is on
<ME60> terminal monitor
Info:Current terminal monitor is on
# 启用业务跟踪功能。
<ME60> system-view
Enter system view, return user view with Ctrl+Z.
[ME60] trace enable
[ME60]
#Jan 19 14:39:22 2007 ME60 BTRC/6/SWITCHINFO:OID 1.3.6.1.4.1.2011.2.6.2.200.4.1100 The switch of service tracing is ON.
# 创建跟踪对象,按照PVC进行业务跟踪。
[ME60] trace object pvc 10/100
#Jan 19 14:43:57 2007 ME60 BTRC/6/ADDOBJ:OID 1.3.6.1.4.1.2011.2.6.2.200.4.1101 Added one trace object (ObjectIndex=4,ipAddr=255.255.255.255).
按照QinQ VLAN进行业务跟踪,用户带uservlan 100和QinQ 100 上线。
# 打开终端调试开关。
<ME60> terminal debugging
Info:Current terminal debugging is on
<ME60> terminal monitor
Info:Current terminal monitor is on
# 启用业务跟踪功能。
<ME60> system-view
Enter system view, return user view with Ctrl+Z.
[ME60] trace enable
[ME60]
#Jan 19 14:39:22 2007 ME60 BTRC/6/SWITCHINFO:OID 1.3.6.1.4.1.2011.2.6.2.200.4.1100 The switch of service tracing is ON.
# 创建跟踪对象,按照QinQ Vlan进行业务跟踪。
[ME60] trace object qinq-vlan 100 user-vlan 100
#Jan 19 14:44:57 2007 ME60 BTRC/6/ADDOBJ:OID 1.3.6.1.4.1.2011.2.6.2.200.4.1101 Added one trace object (ObjectIndex=5,ipAddr=255.255.255.255).
按照接入方式进行业务跟踪,用户以PPPoE的方式接入。
# 打开终端调试开关。
<ME60> terminal debugging
Info:Current terminal debugging is on
<ME60> terminal monitor
Info:Current terminal monitor is on
# 启用业务跟踪功能。
<ME60> system-view
Enter system view, return user view with Ctrl+Z.
[ME60] trace enable
[ME60]
#Jan 19 14:39:22 2007 ME60 BTRC/6/SWITCHINFO:OID 1.3.6.1.4.1.2011.2.6.2.200.4.1100 The switch of service tracing is ON.
# 创建跟踪对象,按照接入方式进行业务跟踪。
[ME60] trace object access-mode pppoe
#Jan 19 14:45:57 2007 ME60 BTRC/6/ADDOBJ:OID 1.3.6.1.4.1.2011.2.6.2.200.4.1101 Added one trace object (ObjectIndex=6,ipAddr=255.255.255.255).
# 其他接入方式的配置在这里不再重复,配置方法同上。
按照用户名进行业务跟踪,用户以PPPoE方式接入,用户名为test@ME60。
# 打开终端调试开关。
<ME60> terminal debugging
Info:Current terminal debugging is on
<ME60> terminal monitor
Info:Current terminal monitor is on
# 启用业务跟踪功能。
<ME60> system-view
Enter system view, return user view with Ctrl+Z.
[ME60] trace enable
[ME60]
#Jan 19 14:39:22 2007 ME60 BTRC/6/SWITCHINFO:OID 1.3.6.1.4.1.2011.2.6.2.200.4.1100 The switch of service tracing is ON.
# 创建跟踪对象,按照用户名进行业务跟踪。
[ME60] trace object user-name test@ME60
#Jan 19 14:46:57 2007 ME60 BTRC/6/ADDOBJ:OID 1.3.6.1.4.1.2011.2.6.2.200.4.1101 Added one trace object (ObjectIndex=7,ipAddr=255.255.255.255).
按照IP地址进行业务跟踪。本例按IP地址 10.164.19.1进行跟踪。
# 打开终端调试开关。
<ME60> terminal debugging
Info:Current terminal debugging is on
<ME60> terminal monitor
Info:Current terminal monitor is on
# 启用业务跟踪功能。
<ME60> system-view
Enter system view, return user view with Ctrl+Z.
[ME60] trace enable
[ME60]
#Jan 19 14:39:22 2007 ME60 BTRC/6/SWITCHINFO:OID 1.3.6.1.4.1.2011.2.6.2.200.4.1100 The switch of service tracing is ON.
# 创建跟踪对象,按照IP地址进行业务跟踪。
[ME60] trace object ip-address 10.164.19.1
#Jan 19 14:47:57 2007 ME60 BTRC/6/ADDOBJ:OID 1.3.6.1.4.1.2011.2.6.2.200.4.1101 Added one trace object (ObjectIndex=8,ipAddr=255.255.255.255).
按照MAC地址进行业务跟踪。本例按MAC地址00e0-fc80-36ad进行跟踪。
# 打开终端调试开关。
<ME60> terminal debugging
Info:Current terminal debugging is on
<ME60> terminal monitor
Info:Current terminal monitor is on
# 启用业务跟踪功能。
<ME60> system-view
Enter system view, return user view with Ctrl+Z.
[ME60] trace enable
[ME60]
#Jan 19 14:39:22 2007 ME60 BTRC/6/SWITCHINFO:OID 1.3.6.1.4.1.2011.2.6.2.200.4.1100 The switch of service tracing is ON.
# 创建跟踪对象,按照MAC地址进行业务跟踪。
[ME60] trace object mac-address 00e0-fc80-36ad
#Jan 19 14:48:57 2007 ME60 BTRC/6/ADDOBJ:OID 1.3.6.1.4.1.2011.2.6.2.200.4.1101 Added one trace object (ObjectIndex=9,ipAddr=255.255.255.255).
上述例子给出了按照单个属性配置业务跟踪,也可以按照多个属性的组合进行业务的跟踪,在此不再赘述。
验证结果
配置完成后,执行display trace object 命令,可以查看配置的业务跟踪信息。如下:
[ME60] display trace object
Object ID : 0
In slot : 1 2 3 4 5 6 7 8
MAC Address : 00e0-fc80-36ad
PVC(VPI/VCI) : *
IP Address : *
VRF Index : *
CID : *
Calling Number : *
User Name : *
Interface : *
QinQ VLAN ID : *
User VLAN ID : *
Access Mode : *
User Tunnel ID : *
Output to command line
Total 1, 1 printed
配置文件
跟踪对象配置不存入配置文件。
|
|
||
|
|
||
|
|
7月26 |
H3CNE认证 |
热报中 |
8月16 |
H3C-IMC认证 |
热报中 |
7月26 |
H3CNE认证 |
热报中 |
7月26 |
H3CIE+认证 |
热报中 |
8月16 |
H3C-IMC认证 |
热报中 |
7月26 |
H3CNE培训 |
热报中 |
7月26 |
H3CSE认证 |
热报中 |
8月16 |
H3C无线 |
热报中 |
7月26 |
H3CSE培训 |
热报中 |
8月16 |
H3CIMC培训 |
热报中 |
8月16 |
H3C无线培训 |
热报中 |
8月31 |
H3CEAD培训 |
热报中 |
8月16 |
H3CPME认证 |
热报中 |
8月16 |
H3C安全认证 |
热报中 |
8月16 |
H3CIMC培训 |
热报中 |
8月16 |
H3C无线培训 |
热报中 |
8月09 |
H3CEAD培训 |
热报中 |
8月16 |
H3CPME认证 |
热报中 |
8月16 |
H3C安全认证 |
热报中 |
8月16 |
H3CIMC培训 |
热报中 |
8月09 |
H3C无线培训 |
热报中 |
8月09 |
H3CEAD培训 |
热报中 |
8月09 |
H3CPME认证 |
热报中 |
8月09 |
H3C安全认证 |
热报中 |